Product
2018
Challenge
Competitive Analytics
Creating a competitive benchmarking software prototype for digital news content.
Outcome
Additional
Details
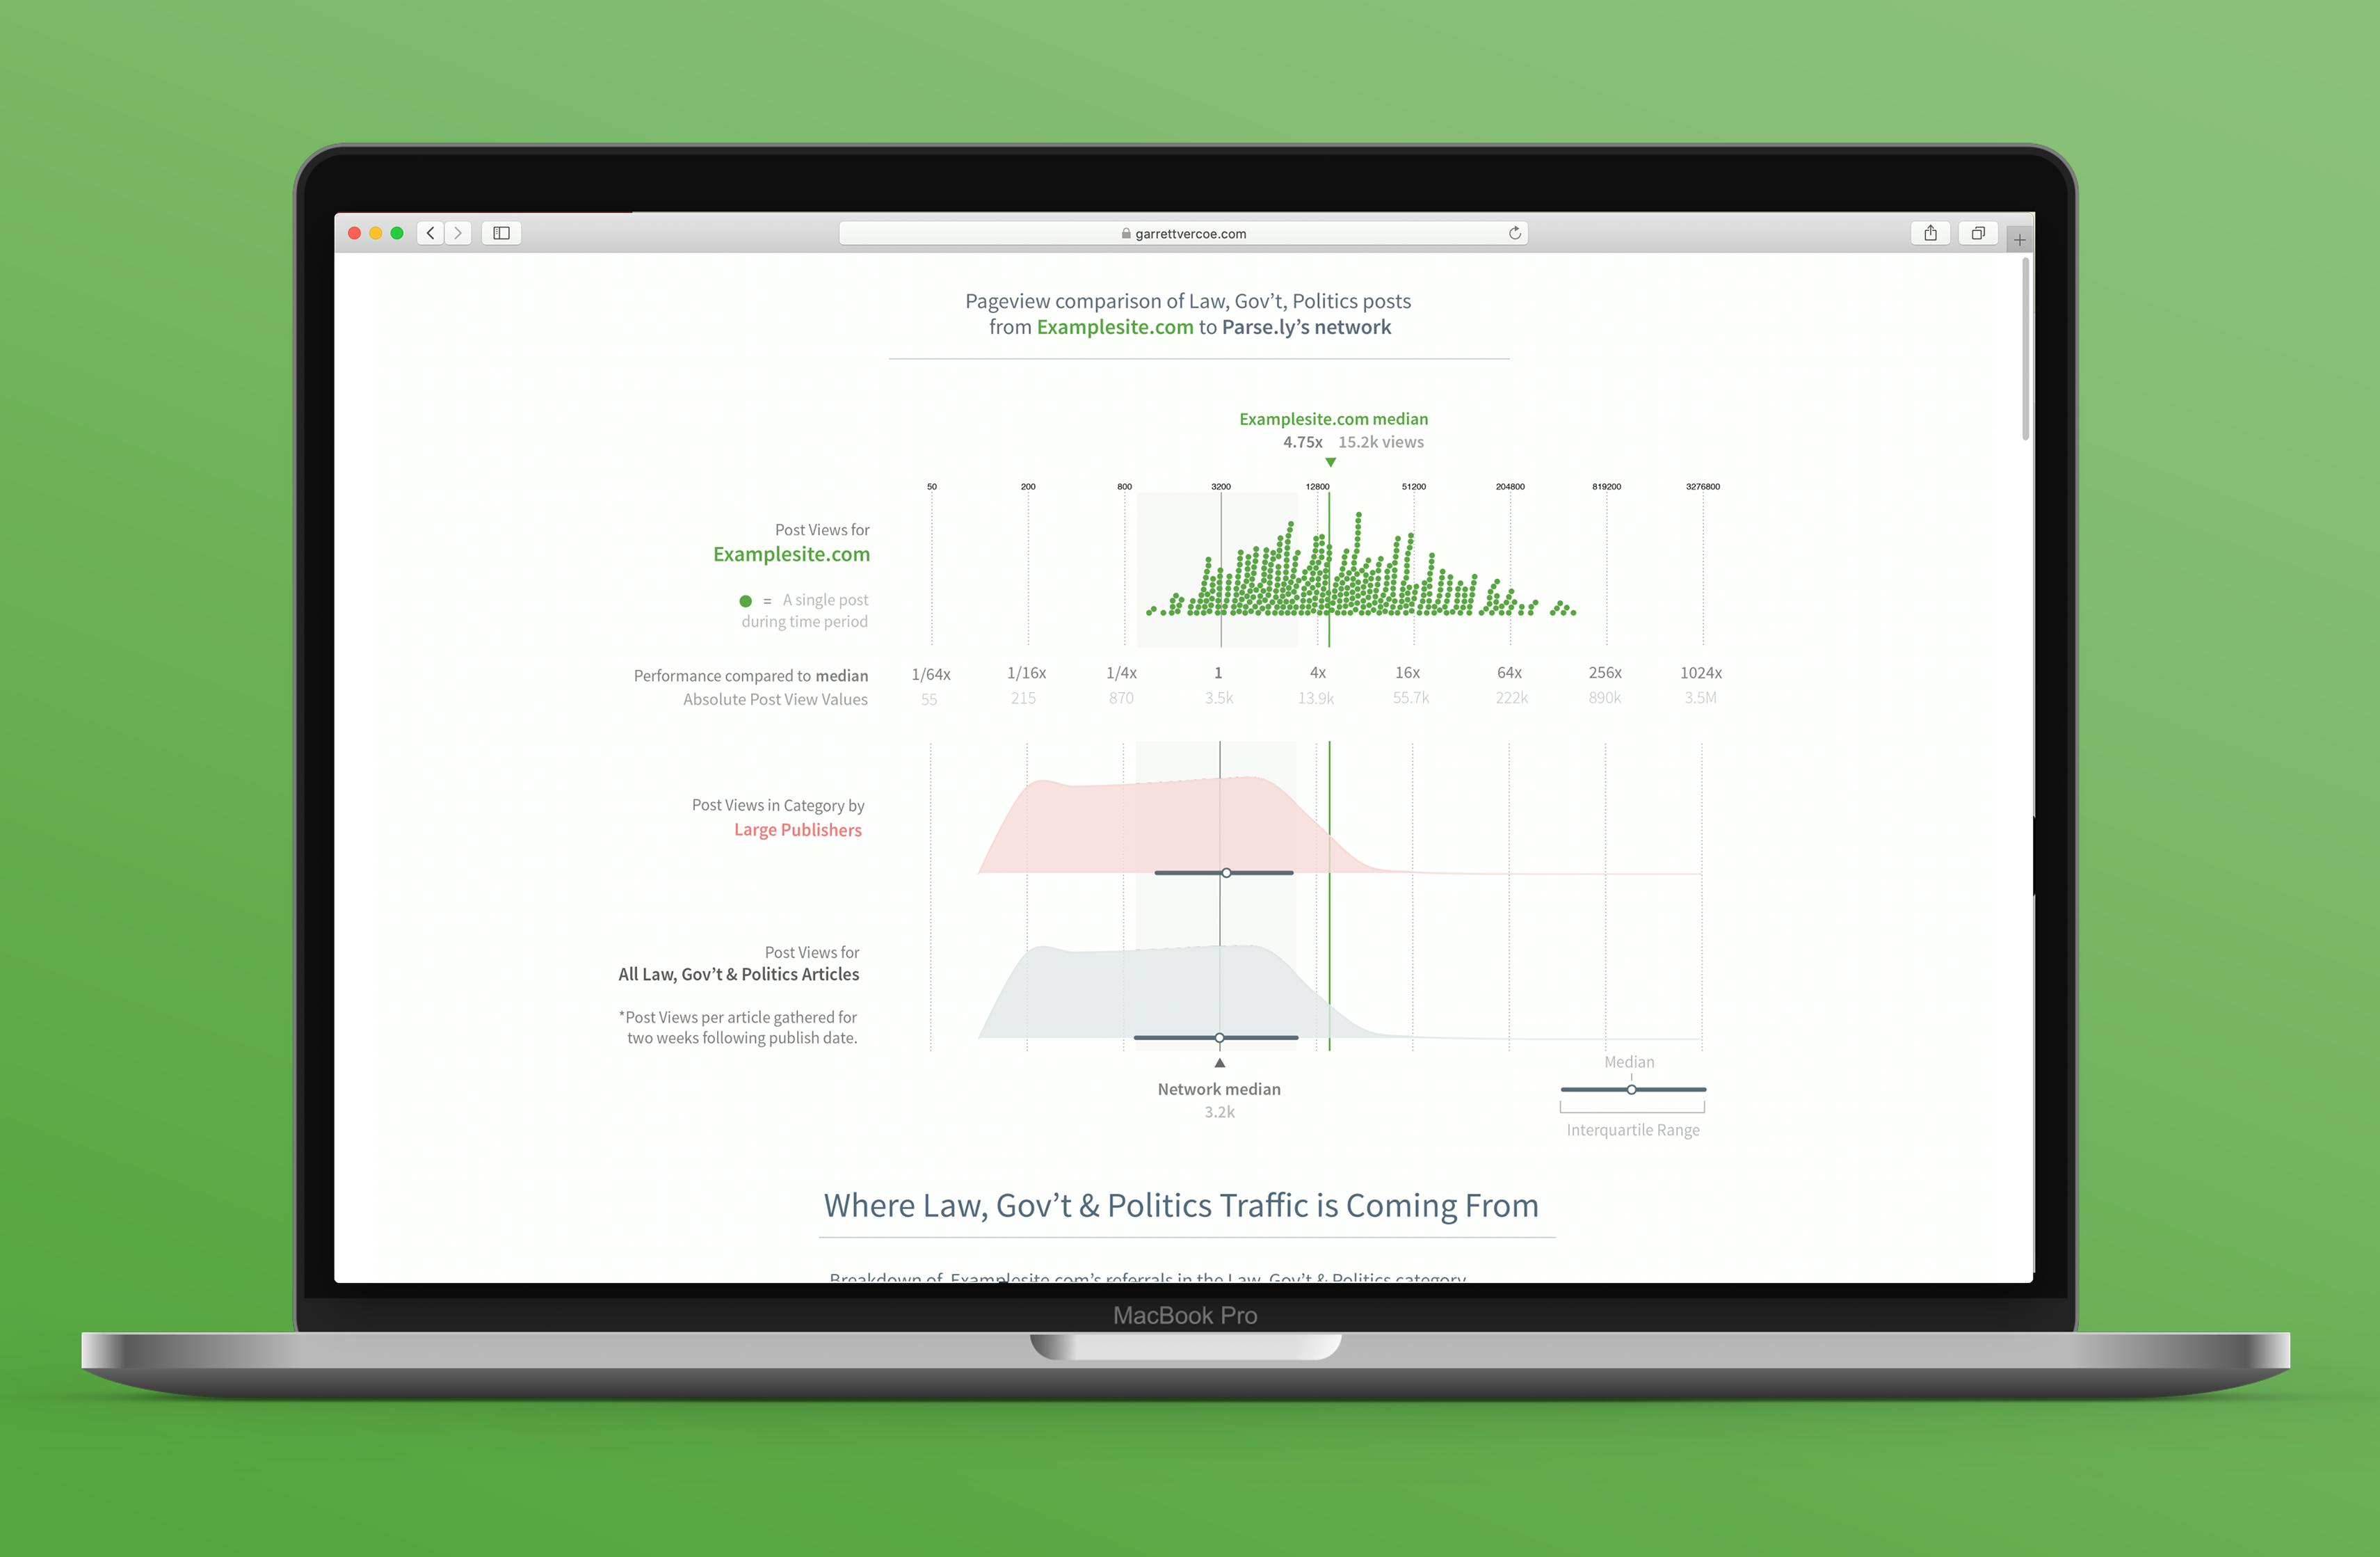
Using Python and D3, I created a prototype web application that allows publishers to compare metrics against their competition.
Top news companies like Conde Nast, Ars Technica, and the Wall Street Journal use Parse.ly to learn of real-time attention shifts for the content on their sites. As a data science intern at Parse.ly in Summer 2018, I created a prototype that helps benchmark where a single publisher stacks up in a sea of publishers. A site can compare how they're doing in any category, and compare that to their own historical record and the performance of a large portion of publishers on the web. I used Python in the backend to automatically pull and create a unique dataset for each customer that generated a report, and D3 to visualize the data on the front-end. This prototype became a product in the Parse.ly Analytics Suite in early 2019, specifically tailored to new customers.
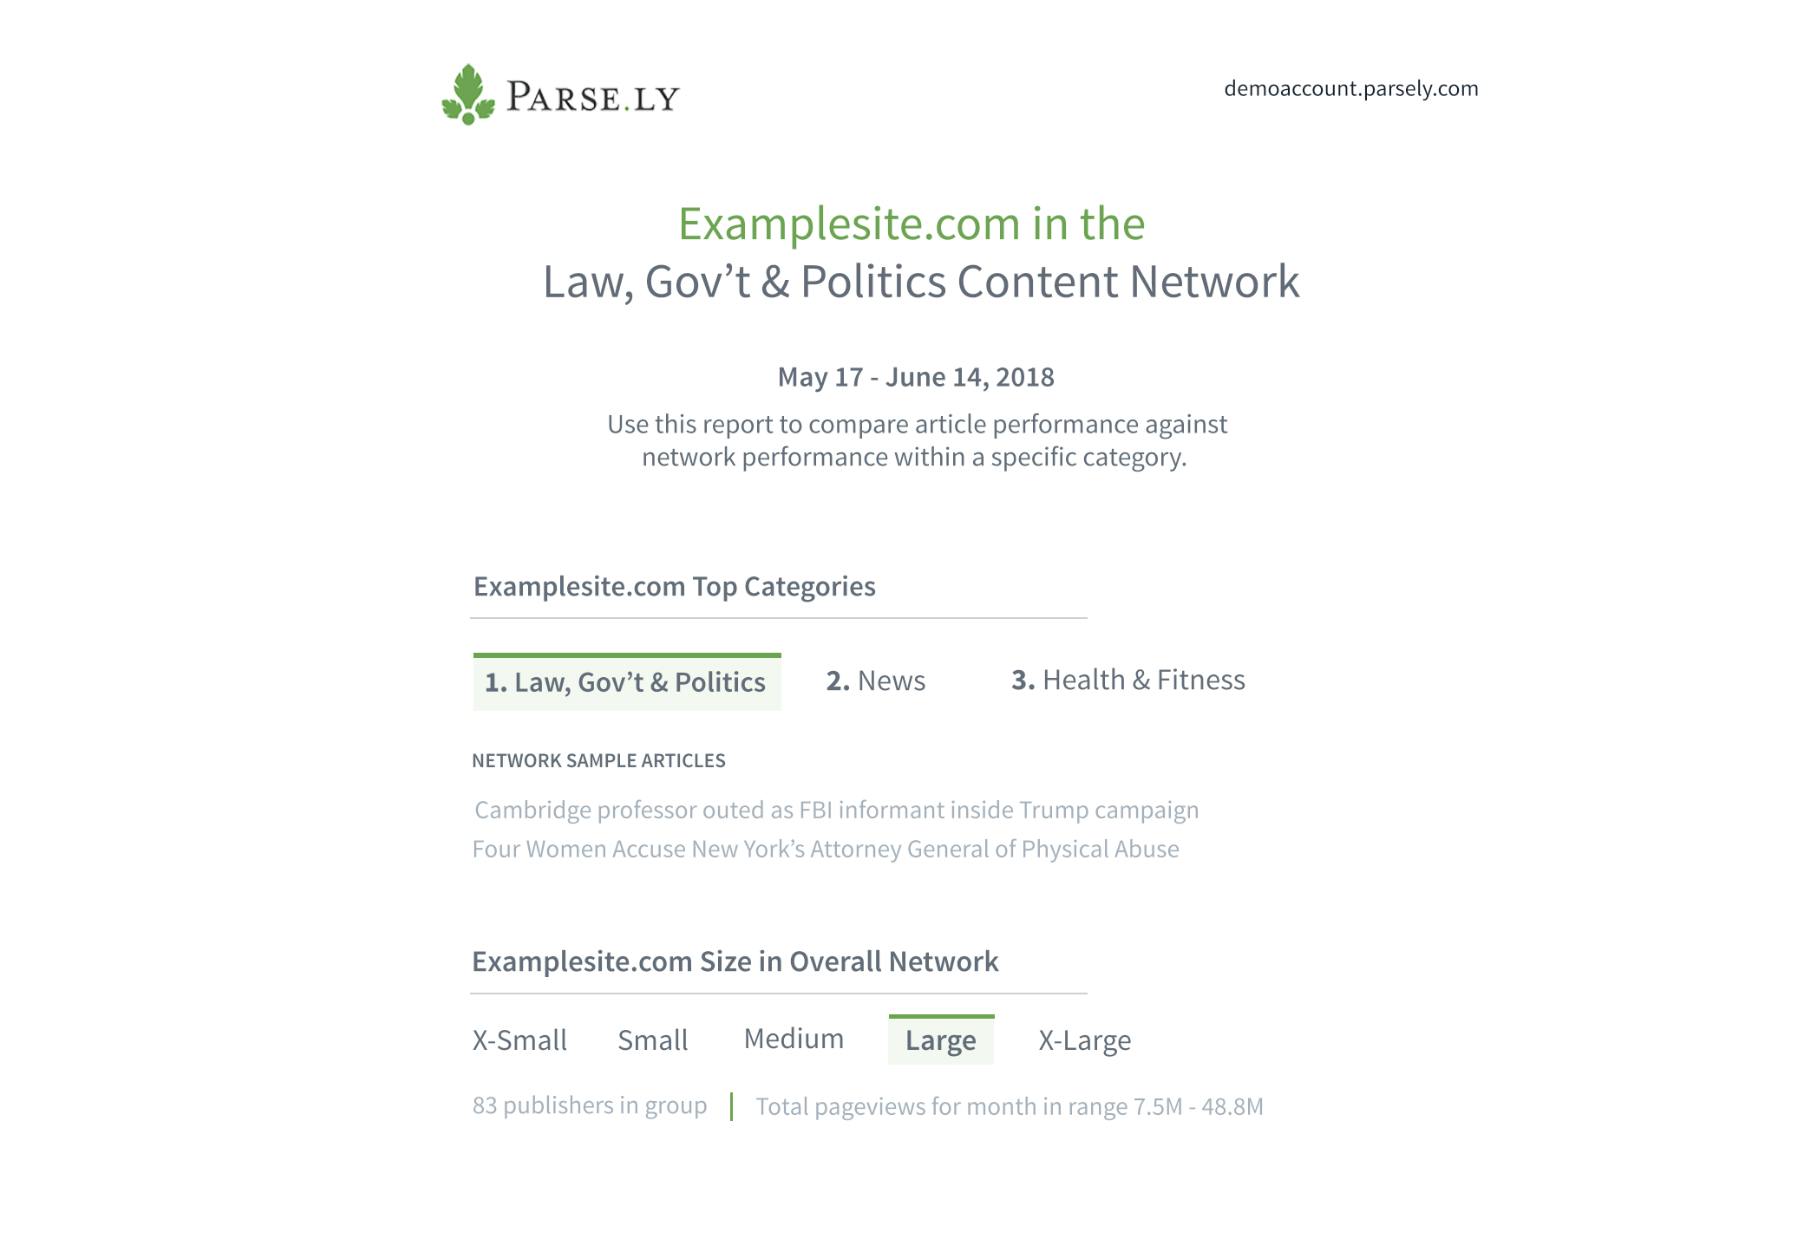
Names redacted for customer privacy. Generate report for a specific category of your site's content.
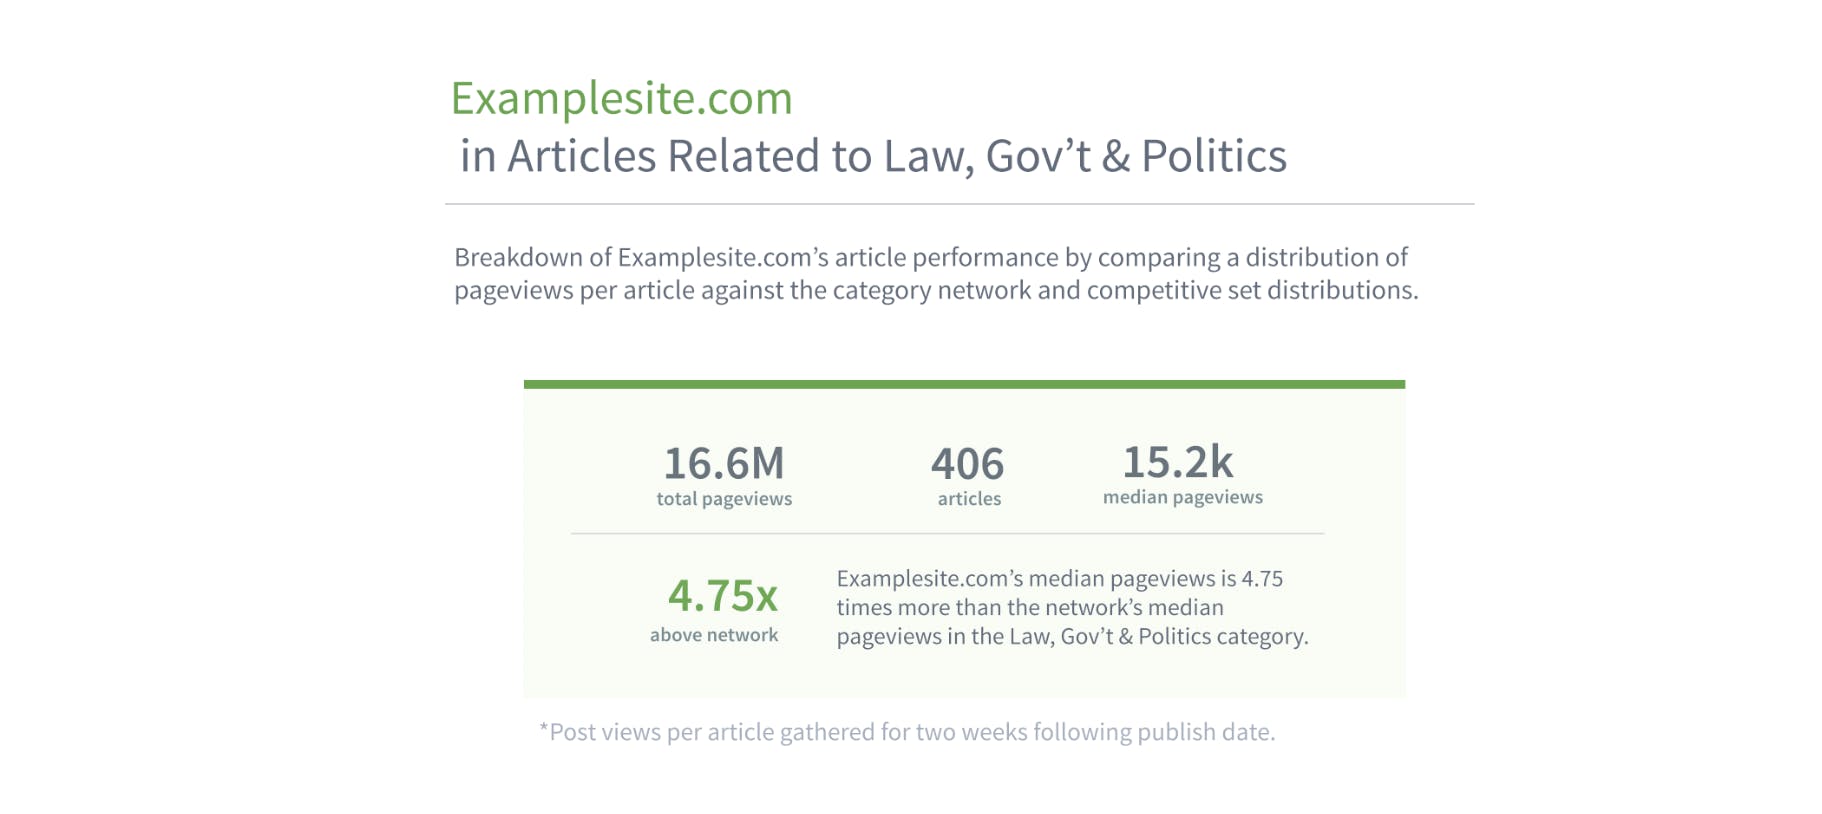
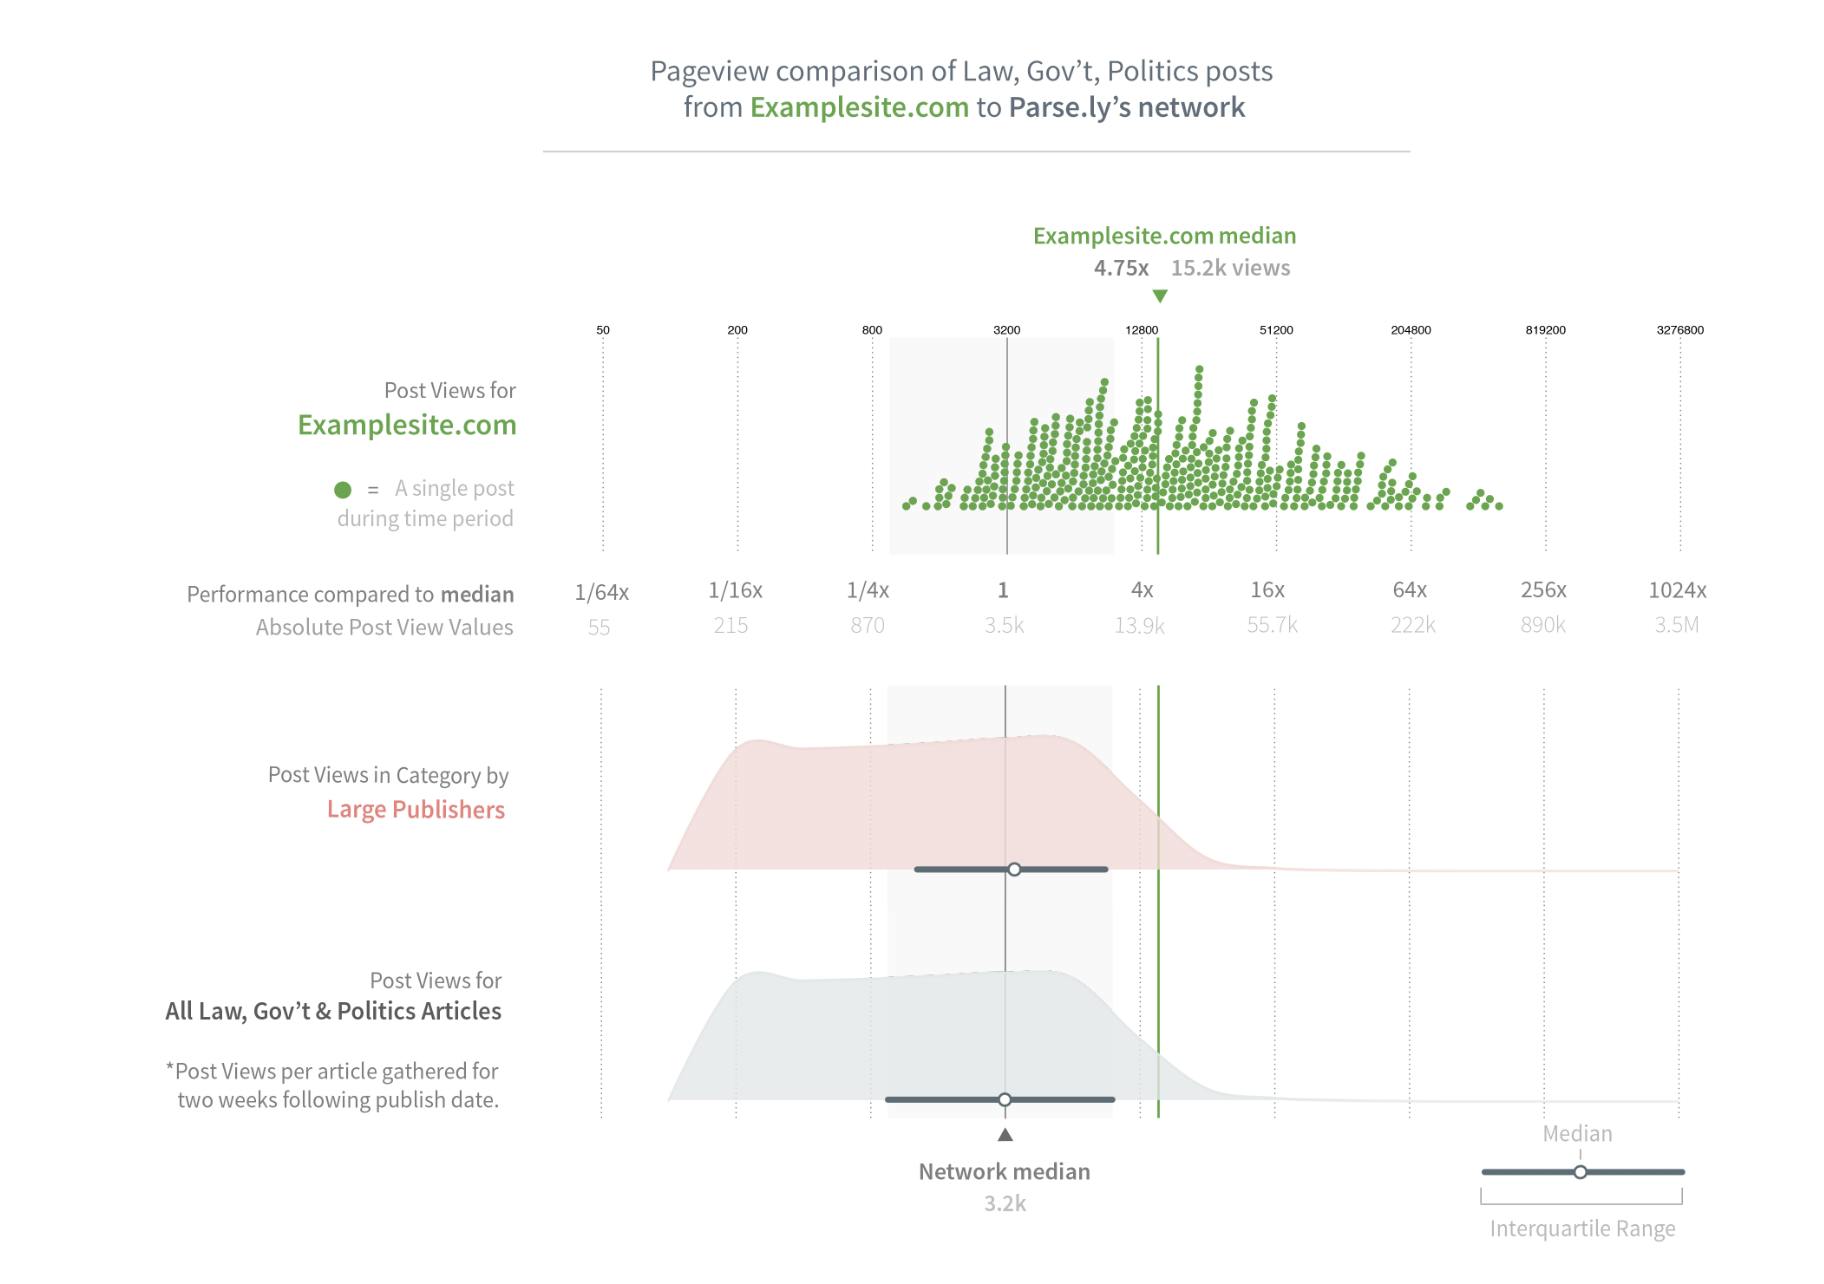
Examplesite's performance is nearly 5 times greater when comparing median performance to the overall network. They can then view the set of posts that performed 100x better than the median.
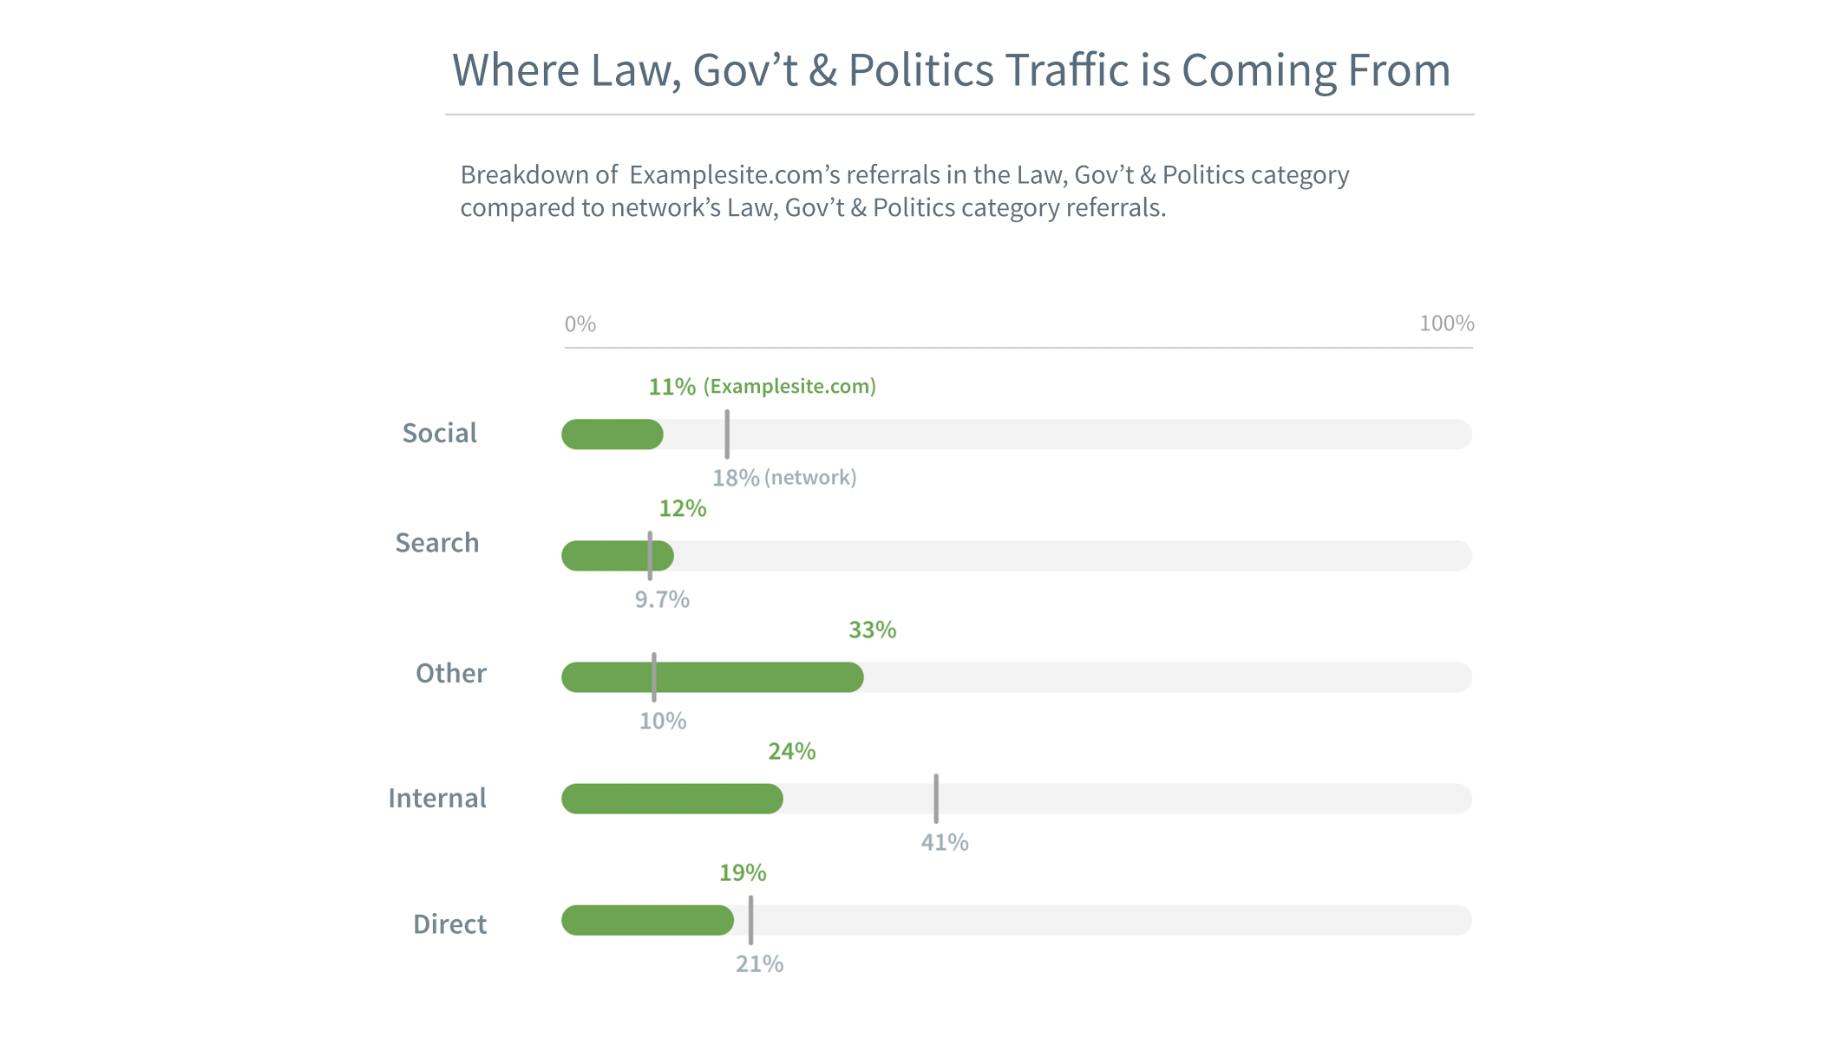
See where site traffic for posts in a category are coming from, and how it compares to the overall network.
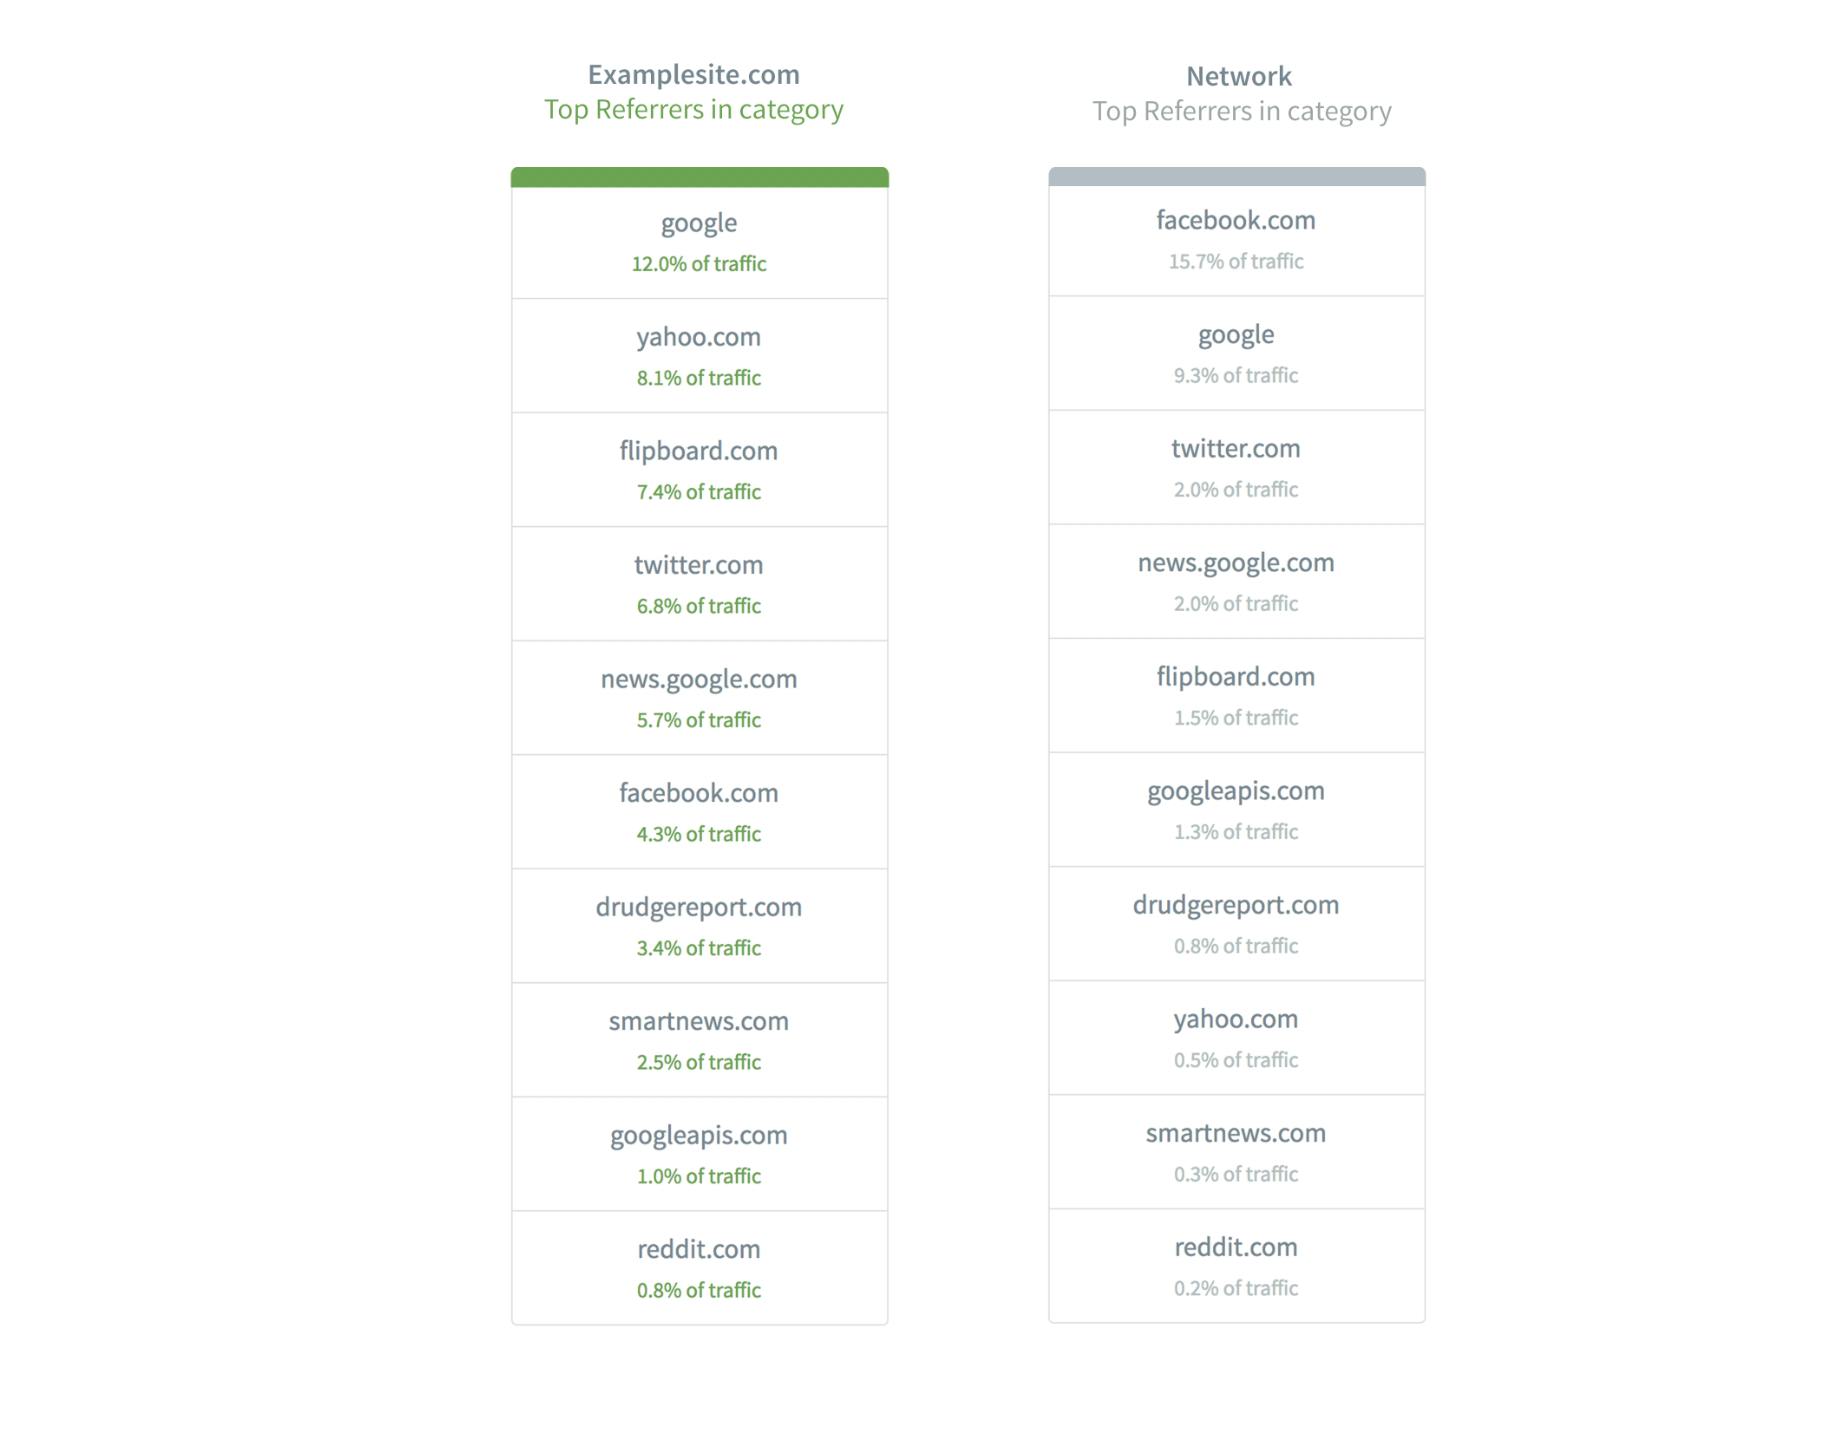
View top referrers.
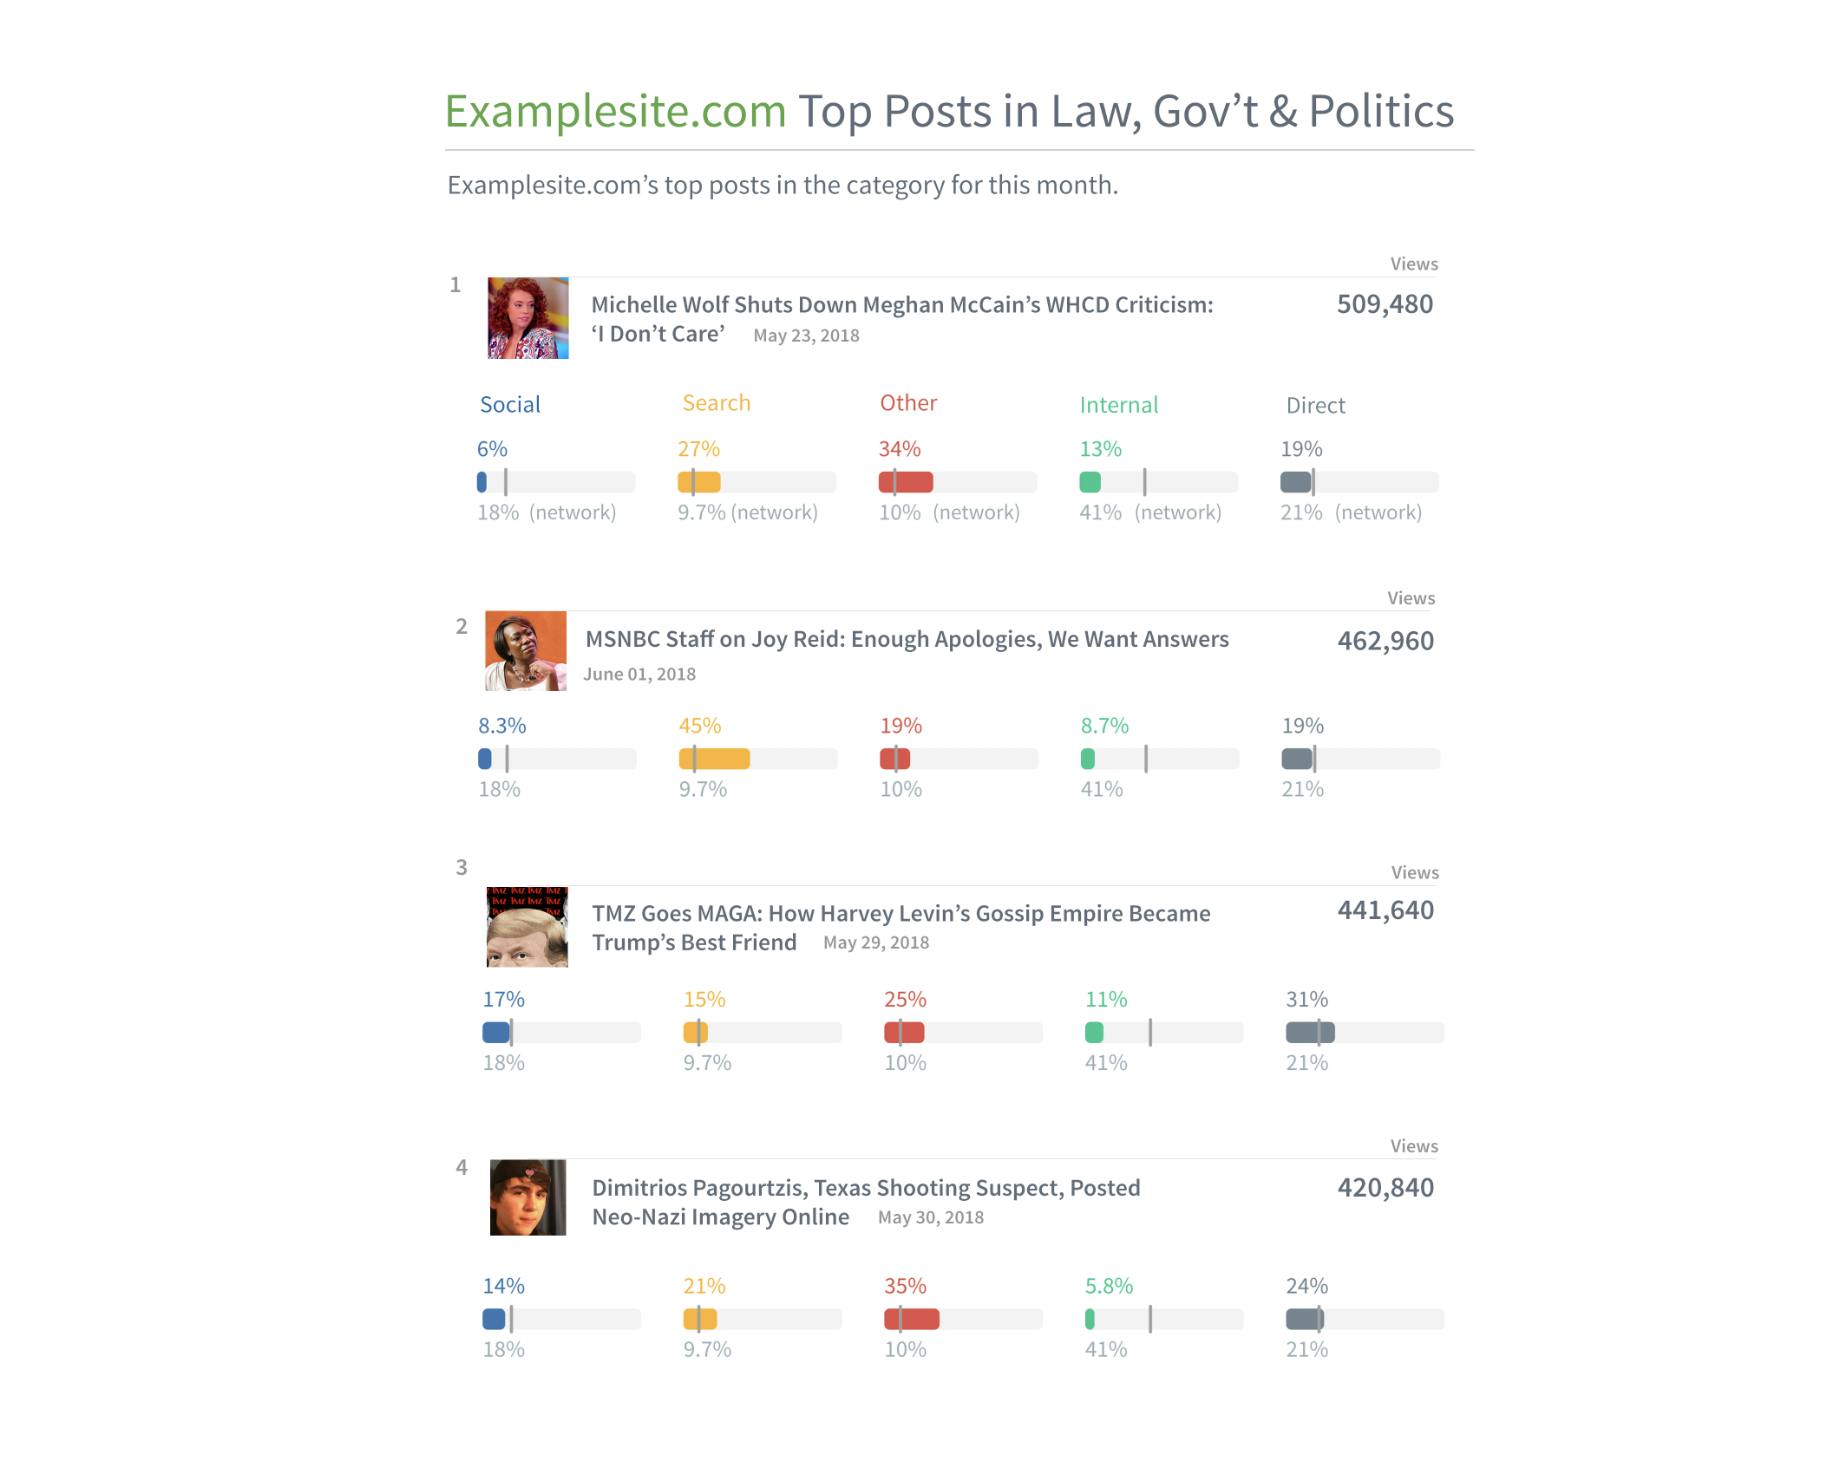
View top posts and their source breakdown.